With all the talk about “climate change” lately, few people realize that the Earth’s climate is actually changing all the time. In the big picture over geologic time, Earth’s climate is dominated by a cycle of roughly 100,000 years long ice ages with short, warm periods of roughly 12,500 years in between and that cycle repeats at regular intervals. This is fact and cannot be denied:
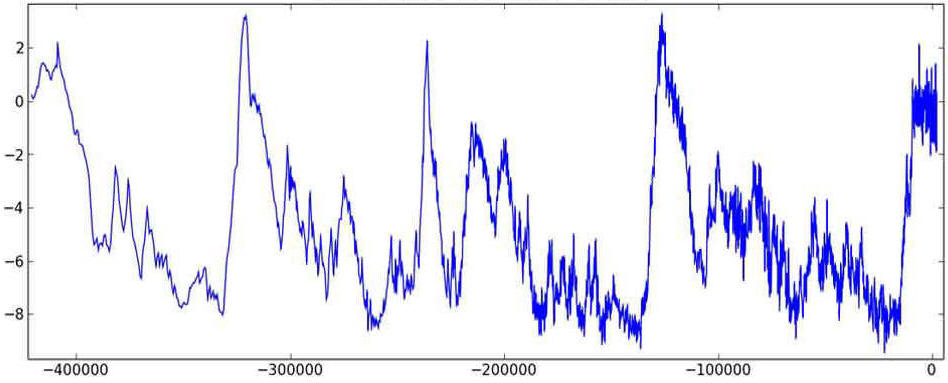
In the graph above of global temperatures over the last 400,000 years or so (obtained from ice cores from Greenland and the Antarctic,) the zero on the top left side marks the level of relatively warm temperatures. The zero on the bottom right marks the present time. The humps above the zero line represent the warm periods and are known as interglacials or in between glacial periods. We are presently in an interglacial and as you can see, they usually don’t last too long before the temperatures start falling and we start a new ice age.
Now, without question we’ve seen warming since the Little Ice Age ended in 1850. But, for most of the present interglacial, it was warmer than it is today. This is apparent in the graph below of temperatures over the last 10,000 years:
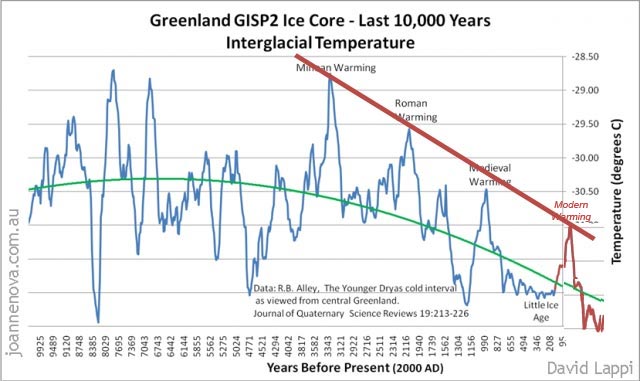
Also notice that the Minoan, Roman and Medieval warming periods shown came at regular intervals. The “Modern Warming” culminating at the present time is just the latest warming in the cycle.
I slightly edited (in red) this version of the graph by David Lappi to show a possible future projection of how the modern warming might play out, based on previous trends. We are just to the right of the top of the modern warming hump at the present time, by all indications.
The Little Ice Age started in the year 1600. It coincided with the Maunder Minimum, which was a period of decreased sunspots on the Sun. Low sunspot numbers means that the solar magnetic field strength is weak.

A weak solar magnetic field decreases the size and strength of the Sun’s heliosphere, which surrounds the entire solar system. The heliosphere shields the Earth and solar system from galactic and intergalactic cosmic rays. The weaker the field, the more cosmic rays hit the atmosphere and vice versa.

It has been found in experiments in cloud chambers here on Earth that cosmic rays induce nucleation of water vapor into small droplets. In the atmosphere, cosmic rays do the same thing and cause high-altitude clouds. So, if the Sun’s magnetic field decreases, more clouds form due to the influence of cosmic rays. That increases the albedo of the Earth and more energy from the Sun is reflected away from the Earth and that causes a cooling effect.

So, what we’re seeing today is a weakening of the Sun’s magnetic field. The last maximum in the solar cycle was much weaker than predicted and measurements of the Sun’s magnetic field strength of sunspots show a steady decline in strength. Soon, the solar cycle will reach the minimum again and sunspots could get very scarce. There are predictions that we could be headed for another Maunder Minimum-type decrease in sunspots. Couple that with natural cyclic variations in our orbit and cyclic ocean current changes and we could see a strong cooling over the next 30 to 50 years.
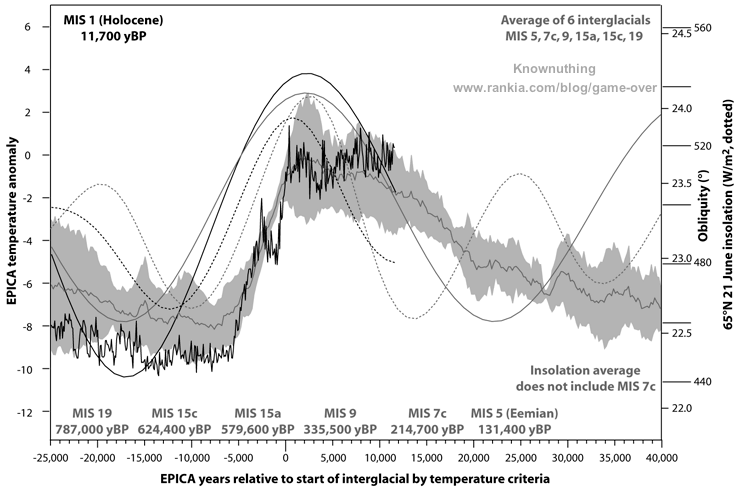
Is it enough to push us into a new ice age? We don’t know. But, what we do know is the present interglacial has lasted about as long as they usually last – 12,500 years. Sooner or later, the present interglacial will end. As seen in the graph below, which is based on an average of a selection of 6 previous interglacials, our warm spell is just about done, that is if our interglacial (the Holocene) follows the historical trend.
There is even the possibility that the beginning or ends of interglacials might be influenced by periodic bombardments of comets into the inner solar system. In other words, if a comet hit the Earth, then the resulting debris injected into the upper atmosphere would cause a strong cooling effect. Couple that with a weak solar magnetic field and more clouds from cosmic rays and the Earth will NOT warm back up after the comet debris clears up. Conversely, if one hit the ocean, the water vapor would induce a greenhouse effect and warm the planet. Periodic bombardments coming at the right time could be, “the straw that broke the camel’s back,” to quote an old cliche’ and would change the climate drastically.
It looks like a series of events working synergistically together might be why we have ice ages and it is only when the Sun becomes more active with a strong magnetic field that the Earth warms up to temperatures like in the present interglacial. The warm interglacials could be caused by clearer skies due to a lack of cosmic rays and therefore more solar energy hits the surface of the Earth.
Some of you may believe the global warming alarmists and their predictions, but the only way to break the cycle of ice ages that has any chance of succeeding is more greenhouse gases in the atmosphere, either through natural or artificial means. This is a fact.
Ignore the above information if you like, but it has more of a chance of being true than anything the global elite/New World Order crowd are promoting. Look up who started promoting “global warming” first and you’ll see it was a Rothschild. LoL!
Mike, this is a truly excellent post, thank you.
What is the exact source of the red ‘tail’ in the GISP2 Holocene temperature chart please? Without this information I cannot circulate it to associates (fully credited of course).
I fully agree with you: the sun, not CO2, caused ‘Modern Warming’, which in fact switched to cooling in 2016 – see NASA’s ‘Global Monthly Mean Surface Temperature Change’ graph here (scroll down to the sixth on the list) …
https://data.giss.nasa.gov/gistemp/graphs/
Please see my ResearchGate notes on CO2’s innocence, e.g. …
https://www.researchgate.net/publication/333172166
https://www.researchgate.net/publication/332245803
With thanks and regards,
Roger
Thanks for the kind words. 🙂
The red tail is my projection. It is not based on any “official” data and is just an eyeball estimated guess of how it might vary based on what happened after the previous warming periods. Lappi’s original only had data to where the cores ended or to about 100 years ago.
I wrote this and made the graphic over 5 yrs ago and you are the first to ever ask about it. It is strictly an amateur’s perspective and not real data that I would advise you use for professional publications.
On the graph from David Lappi in your article it is written “Years Before Present (2000 AD)” while on this article: https://joannenova.com.au/2010/02/the-big-picture-65-million-years-of-temperature-swings/ the same graph says “Years Before Present (1950 AD)”.
Could you please tell me the reason for this difference?
I guess that if 1950 is correct you can already compare your predictions with what happened and what is happening in reality?
As far as I know, the first few feet of ice is useless for dating anything and is ignored. So, the dating will start back at the last “epoch” date -90 to 100 yrs to get past that and to where they get good data.